
INTERNAL SETUP:
-
lsconfig - vitalcheck_feature must be enabled (should be enabled by default)
- Role Permission - must have financial or billing role type to see the dashboard
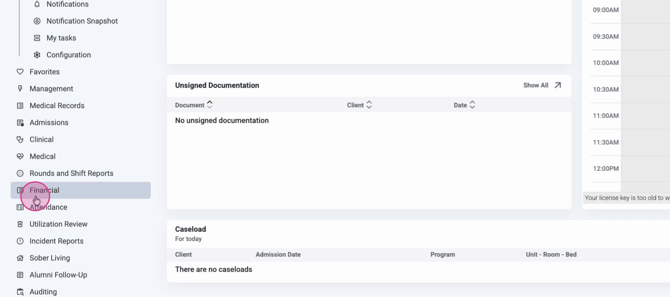
To use VitalCheck, make sure you have financial dashboard permissions.
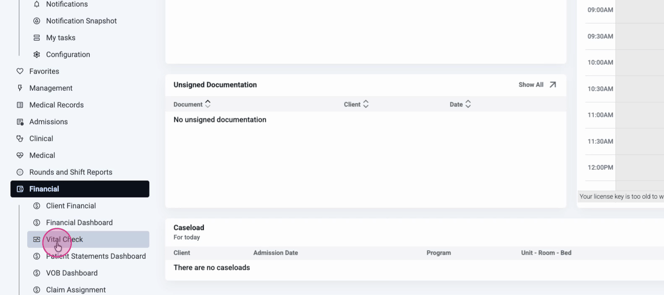
Step 1: From your home screen, navigate to Financial and select VitalCheck.
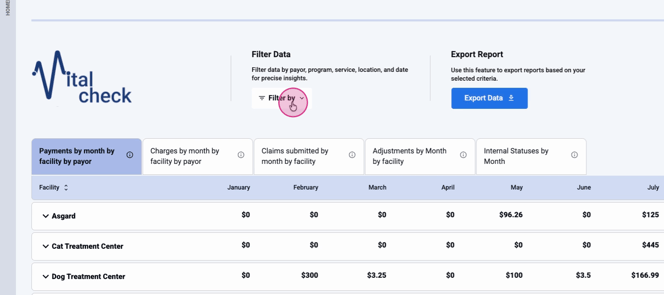
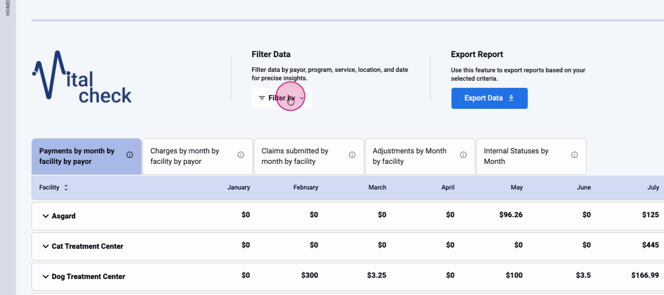
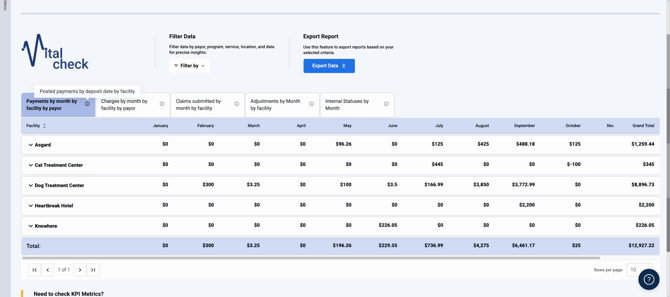
You’ll land on the VitalCheck dashboard, which displays five powerful, pre-built reports—each focused on a different aspect of your financial performance. At the top, you’ll see the dashboard name, filter options, and an export button.
Step 2: Set your filters at the top of the VitalCheck screen.
Filter by:
-
Start and end dates (up to a 12-month span)
-
Locations
-
Payers
-
Payer types
-
Services
Keep in mind, VitalCheck only lets you view reports for one 12-month period at a time.
Step 3: Export your dashboard whenever you need a record of all five reports.
Every export includes all five reports in a single file, and the filters you set will apply to all of them.
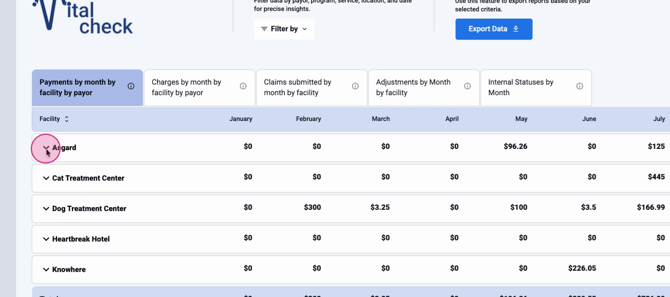
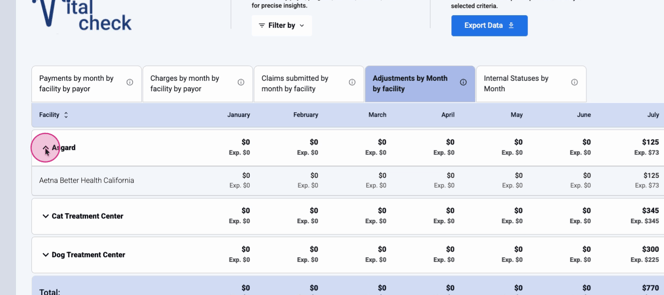
Step 4: Review the Payments by Month, Facility, and Payer report.
-
Displays posted payments by deposit date, broken down by facility and payer.
-
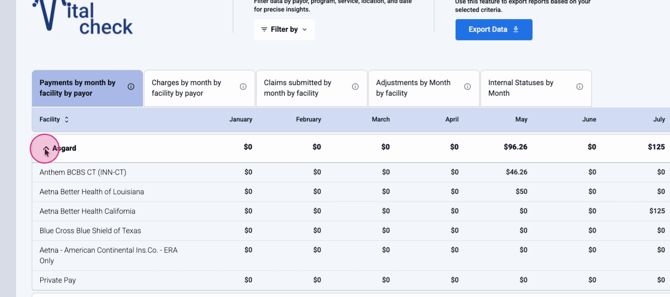
Expand facility rows using the caret to drill into payer details, including private pay.
-
Grayed-out columns for payers sum up to match monthly totals.
-
Each row has a grand total, and a totals row below adds up all facilities and payers for the month.
-
The bottom corner shows a grand total for your selected period.
-
Navigate large datasets with pagination, and adjust row display per page as needed.
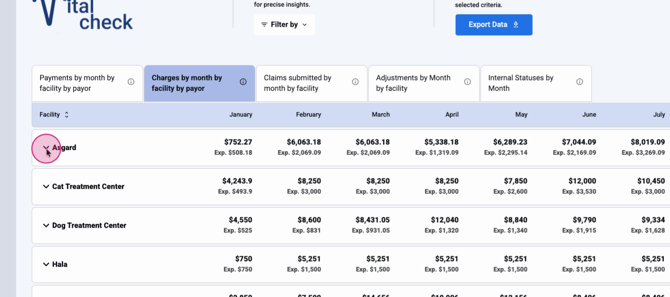
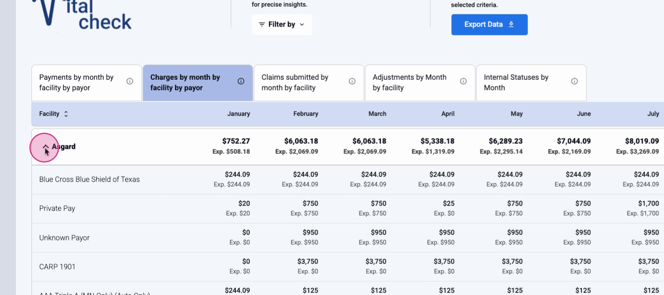
Step 5: Explore the Charges by Month, Facility, and Payer report.
-
Shows gross charges by date of service and facility.
-
See both gross charge and EXP (expected revenue) values for clear revenue forecasting.
-
Expand rows for detailed payer breakdowns.
-
The totals row covers both gross and expected revenue for the period.
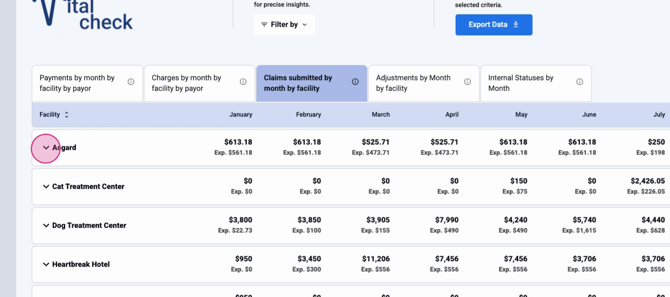
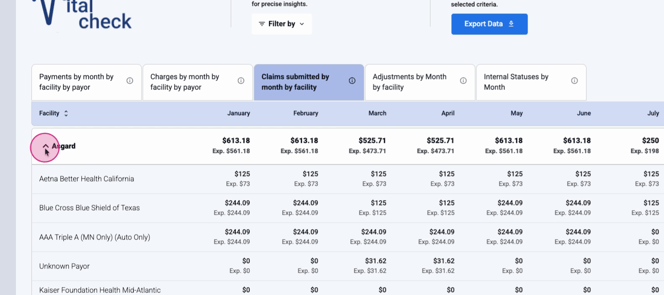
Step 6: Analyze Claims Submitted by Month and Facility.
-
Tracks gross claims submitted by month and facility, based on claim submission dates.
-
Private pay isn’t included.
-
Expand for expected revenue and gross amount by payer.
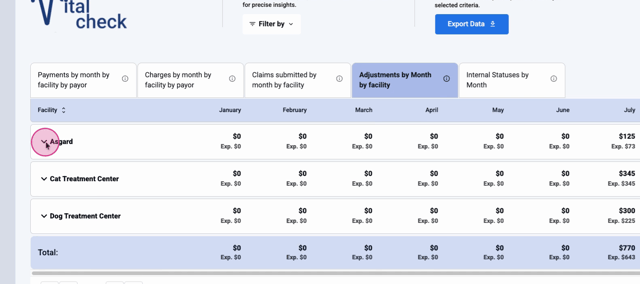
Step 7: Check Adjustments by Month and Facility.
-
Monitors claim adjustments by deposit date and facility.
-
Spot adjustments trends over time.
-
Expand to see payer contributions.
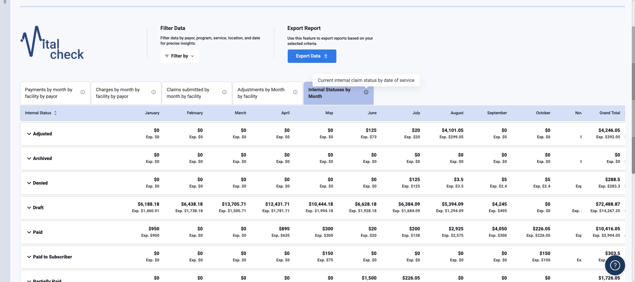
Step 8: Monitor Internal Status by Month.
-
View your current internal claim status by date of service.
-
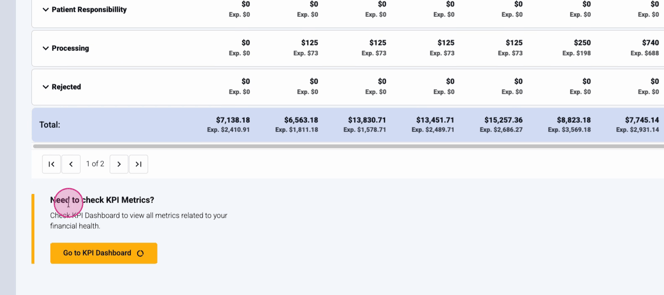
See how much gross money and expected revenue is tied up in each status.
-
Quickly spot outstanding claims or opportunities for operational improvement.
If you have permissions for the KPI dashboard, you’ll see a direct link to it at the top—enabling seamless access to more in-depth analytics. (If you don’t have access, the link won’t appear.)
VitalCheck turns your financial data into clear, actionable insights. Use its interactive reports and filters to keep your organization on track. For questions, contact support or check your internal documentation.